Stem –and–Leaf Plots
In this article, we are going to give you more information about the stem and leaf plot and how to draw it.

What are Stem and Leaf Plots?
Stem and leaf plots additionally are known as stem and leaf diagrams. It’s a way of managing information in a form that makes it simple to see the occurrence of different kinds of values.
It’s a graph showing numerical data assembled in order. Each data value gets broken down into a stem as well as a leaf.
Stem and leaf plots get represented in the form of a special kind of table where each \(1\)st digit or numeral of data value gets split up into a stem and then the final digit of information in a leaf. This ” \(|\) ” symbol is utilized to exhibit stem and leaf values and it’s known as the stem and leaf plot key.
Related Topics
How do you Read Stem and Leaf Plots?
A stem and leaf plot key assists in understanding the data values. The stem is shown on the left but a leaf is shown on the right. If the values of the stem and the leaves are combined, you end up with the data values.
How do you Split a Stem and Leaf Plot?
A split stem and leaf plot divides each stem into numerous stems dependent on its occurrence. We put smaller leaves on the \(1\)st part of a split stem and put the bigger leaves on successive stems.
How do you create a Stem and Leaf Plot?
Follow these steps to create a stem and leaf plot.
- Step one: Examine the info and locate the number of figures. Categorize them as two or three-digit numerals.
- Step two: Install a stem and leaf plot key. For instance, \(2\) | \(4 = 24\), as well as \(3\) | \(1\) is \(31\).
- Step three: Distinguish the \(1\)st figures as stems and make the final numeral as leaves.
- Step four: Define the data’s range, i.e. the bottom and the top values amongst your data.
- Step five: Create a vertical line. Put the stem on the lefthand column and put the leaf on the righthand column.
- Step 6: Put these stems in the stems column. Organize it in rising order beginning with the lowest possible to the highest.
- Step seven: Plot these leaves in the column compared to the stem from the least to the most horizontally.
Crucial Notes
Here are a few vital notes related to stem and leaf plots. Be sure to read them!
- If info is plotted using stem and leaf and you place the data next to the brand-new information, we may be able to notice a link between both the data and the frequency of dissemination of information.
- A stem and leaf plot key for \(3\)-digit numbers is characterized via \(2\) digits in a stem as well as \(1\) numeral in a leaf. For instance, \(43\) | \(2\) \(= 432\)
- The mean, mode, and median of the provided info are calculated easily by utilizing stem and leaf plots.
Stem –and–Leaf Plots – Example 1:
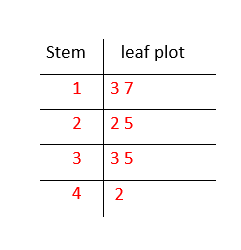
Make a stem and leaf plot for the given data.
\(42,35,13,22,17,33,25\)
Solution:
First, you should arrange data from small to large: \(13,17,22,25,33,35,42\). Draw a stem-and-leaf plot. Note that the stem is the left column and the leaf is the right column. Divide each number into two parts: stem part and leaf part. The “ones'” digit is located in the leaf column. Note if the data is in one digit, we put zero in the stem section.
Stem –and–Leaf Plots – Example 2:
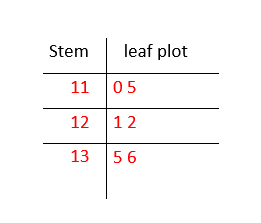
Make a stem and leaf plot for the given data.
\(110,121,135,115,122,136\)
Solution:
First, you should arrange data from small to large: \(110,115,121,122,135,136\). Draw a stem-and-leaf plot. Note that the stem is the left column and the leaf is the right column. Divide each number into two parts: stem part and leaf part. The “ones'” digit is located in the leaf column. Note if the data is in one digit, we put zero in the stem section.
Exercises for Stem –and–Leaf Plots
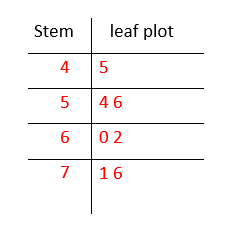
Make stem and leaf plots for the given data.
- \(\color{blue}{54,76,62,56,71,60,45}\)
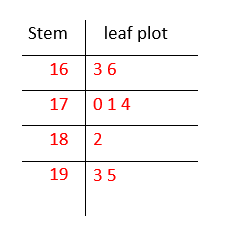
- \(\color{blue}{170,166,193,182,163,171,195,174}\)

1.
2.

Related to This Article
More math articles
- FREE SAT Math Practice Test
- How to Determine the Missing Number when Multiplying Decimals by Powers of 10
- How to Solve Trigonometric Equations?
- How to Use Strip Diagrams to Solve Multi-step Word Problems
- What is the Best Algebra Book in the World?
- DAT Quantitative Reasoning Math Practice Test Questions
- 6th Grade SOL Math Worksheets: FREE & Printable
- What Are the Applications of the Law of Cosines?
- Area Models Unveiled: How to Divide Unit Fractions by Whole Numbers
- The Best Calculator for PSAT 8/9 Math Test


What people say about "Stem –and–Leaf Plots - Effortless Math: We Help Students Learn to LOVE Mathematics"?
No one replied yet.