Pie Graphs
What is a pie graph and what is its use in statistics? This is the question we intend to answer in this article.

Pie Charts
Pie charts are a graphic interpretation of information in the format of a round chart or pie whereas the pie slices of the pie represent the size of the information.
A list of mathematical variables, as well as categorical variables, is required to signify information in the format of the pie chart.
The arc length of each of the slices and thus the area, as well as the central angle it shapes in the pie chart, is proportional to the amount it embodies.
Related Topics
The formula for Pie Charts
The full value of a pie chart is constantly \(100\) percent. Plus a circle subtends a \(360°\) angle. Consequently, the full value of all the information equals \(360°\). Established on these, there are \(2\) primary formulas utilized for pie charts:
To determine the percentage of the provided information, you utilize this formula: \((Frequency ÷ Total Frequency) × 100\)
To transform the information into degrees utilize this formula: \((Provided Data ÷ Total value of Information) × 360°\)
You can determine the percentage for a particular pie chart via the following steps:
Step one: Classify the provided info and determine its total
Step two: Divide up the various categories
Step three: Transform the information into percentages
Step four: Compute the degrees
Pie Chart Uses
When info must be shown visually via a fractional section of a whole, you utilize a pie chart. It’s utilized for comparing info and seeing the reason one part is lesser/larger than the other.
Consequently, whenever you’re faced with a limited amount of buckets as well as distinct data sets, it is a better idea to utilize pie charts. Here are several uses for pie charts:
- In a company, it’s utilized for comparing growth areas like profits and losses.
- In a school, a pie chart is utilized for showing time allocated to each of the sections, showing students’ grades as percentages, and more.
- A pie chart is utilized for comparison of the relative amount of information regarding individuals owning identical vehicles, comparable homes, and more.
- They’re utilized for showing marketing and sales information for comparing several brands.
Creating Pie Charts
These are the steps utilized to make pie charts. By using the previously mentioned formulas, you can figure out the info.
- Step one: Put every bit of info into a table, then add all values to find out the total.
- Step two: To discover the values in the format of a percentage, you must divide each of the values by the total, then multiply it by \(100\).
- Step three: To discover the number of degrees for each pie sector needed, you take a complete circle of \(360°\) and utilize this formula: \((\frac{Frequency}{Total Frequency})\ × 360°\)
- Step four: When all degrees for making a pie chart get determined, draw your circle (pie chart) utilizing the computed measurements with the assistance of a protractor.
Pie Graphs – Example 1:
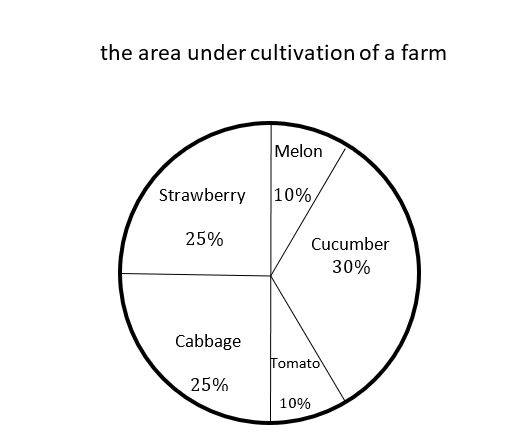
the following pie graph shows the area under cultivation of a farm. The area of land used to plant melon is \(250\) meters. Answer the following question based on the Pie graph.

How many meters of the farm have been spent on planting strawberries?
Solution:
The area of land used to plant melon \(=250\) meters.
Percentage of the amount of strawberries planted \(=25%=0.25\). Then, the area of the farm that has been spent on planting strawberries: \(0.1 × x=250 → x=\)\( \frac{250}{0.1}=2,500 → 2,500 × 0.25=625m\)
Exercises for Pie Graphs
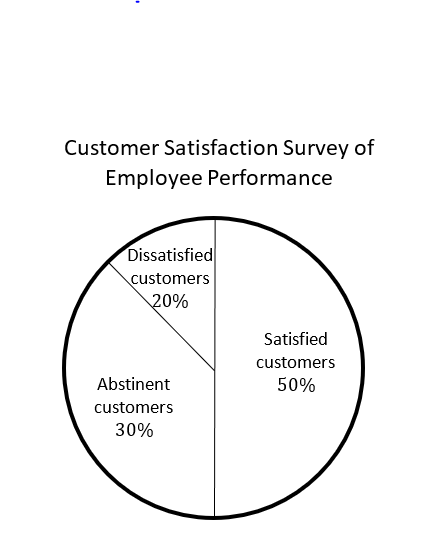
The pie graph below shows the percentage of customer satisfaction with the performance of a store’s employees. The number of abstinent customers in this survey is \(45\). Answer the following questions based on the Pie graph.

- How many customers are satisfied?
- How many customers are dissatisfied?
- What is the total number of customers participating in the survey?

- \(\color{blue}{75}\)
- \(\color{blue}{30}\)
- \(\color{blue}{150}\)
Related to This Article
More math articles
- How to Solve Function Notation? (+FREE Worksheet!)
- FREE 8th Grade PARCC Math Practice Test
- 7th Grade OST Math Worksheets: FREE & Printable
- 5th Grade AZMerit Math Worksheets: FREE & Printable
- 8th Grade Ohio’s State Tests Math Worksheets: FREE & Printable
- The Ultimate PARCC Algebra 1 Course (+FREE Worksheets)
- The Ultimate College Mathematics Course (+FREE Worksheets & Tests)
- How Does the Process of Renting Books from Online Bookstores Work? A Guide for Students
- Discovering the Magic of Triangle Midsegments
- Mastering Series Convergence with the Ratio Test


What people say about "Pie Graphs - Effortless Math: We Help Students Learn to LOVE Mathematics"?
No one replied yet.