How to Interpret Pie Graphs? (+FREE Worksheet!)
Pie graphs represent data in a circle. Here, you can learn how to read or use pie graphs or circle charts.
Related Topics
- How to Interpret Histogram
- How to Solve Probability Problems
- How to Solve Permutations and Combinations
- How to Find Mean, Median, Mode, and Range of the Given Data
Step-by-step guide to solving Pie Graph problems
- A Pie Chart is a circle chart divided into sectors, each sector represents the relative size of each value.
- To solve problems related to pie graphs, first, categorize your Data, find the Total, and find the value for each category or sector.
The Absolute Best Books to Ace Pre-Algebra to Algebra II

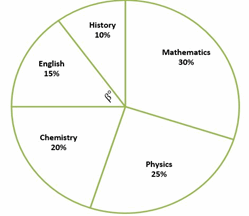
Pie Graph – Example 1:
A library has \(670\) books that include Mathematics, Physics, Chemistry, English, and History. Use the following graph to answer the question. What is the number of Mathematics books?

Solution:
Number of total books \(=670 \)
Percent of Mathematics books \(=30\%=0.30\)
Then: \(0.30×670=201\)
Pie Graph – Example 2:
A library has \(840\) books that include Mathematics, Physics, Chemistry, English, and History. Use the following graph to answer the question. What is the number of Mathematics books?
Solution:
Number of total books \(=840 \)
Percent of Mathematics books \(=30\%=0.30\)
Then: \(0.30×840=252\)
Exercises for Solving Pie Graph
The Best Book to Help You Ace Pre-Algebra
Answer the following questions based on the Pie graph.
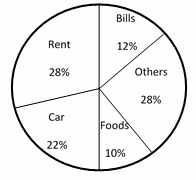
Jason spent \($2,500\) last month.
- How much did Jason spend on his car last month?
- How much did Jason spend on food last month?
- How much did Jason spend on his rent last month?
- What fraction is Jason’s expenses for his bills and car out of his total expenses last month?
Download the Pie Graph Worksheet

- \(\color{blue}{$550}\)
- \(\color{blue}{$250}\)
- \(\color{blue}{$700}\)
- \(\color{blue}{\frac{17}{50}}\)
The Greatest Books for Students to Ace the Algebra

Related to This Article
More math articles
- How Is the CLEP College Algebra Test Scored?
- CHSPE Math-Test Day Tips
- Top 10 8th Grade SBAC Math Practice Questions
- FREE CBEST Math Practice Test
- How to Use Strip Models to Subtract Fractions with Like Denominators
- Math Courses Required For A Business Degree
- Algebra Puzzle – Challenge 40
- How to Find the Volume of Cones and Pyramids? (+FREE Worksheet!)
- 10 Most Common 6th Grade NYSE Math Questions
- SAT Math Vs. High School Math

What people say about "How to Interpret Pie Graphs? (+FREE Worksheet!) - Effortless Math: We Help Students Learn to LOVE Mathematics"?
No one replied yet.