How to Solve Word Problems Involving Completing a Table and Making a Graph?
Word problems involving completing a table and making a graph typically require you to use given information to fill in a table or chart, and then use that data to create a graph. These types of problems often involve real-world situations, such as sales data, population growth, or weather patterns.

A Step-by-step Guide to Solve Word Problems Involving Completing a Table and Making a Graph
To solve these problems, you will need to carefully read and understand the given information, identify the variables that need to be tracked and plotted, and use mathematical operations to calculate missing data points.
You will then need to use this information to create a graph that accurately represents the data and highlights any important trends or patterns.
For example, a word problem involving completing a table and making a graph might ask you to analyze the sales data for a particular product over the course of a year.
You would need to fill in a table with the sales figures for each month, calculate the total sales for the year, and then use this information to create a graph that shows the monthly sales trends and highlights any spikes or dips in sales.
Overall, these types of problems require you to use your mathematical and analytical skills to interpret and represent data in a clear and meaningful way.
Word Problems Involving Completing a Table and Making a Graph – Examples 1
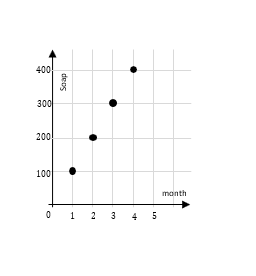
Jennifer is starting a new business selling handmade soap. She wants to keep track of her sales for the first \(4\) months. She must be able to sell \(100\) soap per month. Complete the table and graph the data from the table.
| Month | Total Soaps Sold |
| \(1\) | ______________ |
| \(2\) | ______________ |
| \(3\) | ______________ |
| \(4\) | ______________ |
Solution:
Figure out the total soaps sold after one month: \(1=100\). After two months: \(2=200\), three months: \(3=300\) and four months: \(4=400\).
Utilize the table to write down ordered pairs of numbers. For each pair, write down the number of months first and then the total number of soaps sold, \((1,100),(2,200),(3,300),(4,400)\).
Then, graph the ordered pairs. Begin with the first pair, \((1,100)\).
| Month | Total Soaps Sold |
| \(1\) | \(100\) |
| \(2\) | \(200\) |
| \(3\) | \(300\) |
| \(4\) | \(400\) |
Now create a graph according to the table:

Related to This Article
More math articles
- How to Accurately Calculate the Area Between Polar Curves Using Integrals
- PSAT Math Formulas
- How to Solve Pythagorean Theorem Word Problems
- TExES Core Subjects Math Formulas
- The Ultimate Praxis Algebra 1 (5162) Course (+FREE Worksheets)
- PERT Math – Test Day Tips
- How to Prepare for the DAT Quantitative Reasoning Math Test?
- What does SAT Stand for?
- What Kind of Math do You Need to Be a Medical Assistant?
- 3rd Grade MEAP Math Worksheets: FREE & Printable


What people say about "How to Solve Word Problems Involving Completing a Table and Making a Graph? - Effortless Math: We Help Students Learn to LOVE Mathematics"?
No one replied yet.