How to Measures of Dispersion?
Measures of Dispersion: what to notice and how to work it
What to notice first
Common student mistake
Key formulas and cues
A reliable path
- Identify the questionDecide whether you need center, spread, shape, or association.
- Use the right displayChoose a histogram, box plot, scatter plot, or summary statistic.
- Write the meaningExplain what the statistic says about the data set.
Worked examples
Find IQR
- IQR measures the middle 50%.
- Subtract Q1 from Q3.
- 20 – 8 = 12.
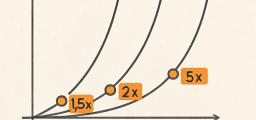
Read association
- As x increases, y tends to increase.
- That is a positive association.
- A best-fit line should have positive slope.
Try one before moving on
Measures of Dispersion: pop-up practice
Related Topics
A step-by-step guide to measures of dispersion
Measures of dispersion can be defined as positive real numbers that measure the degree of homogeneity or heterogeneity of the given data.
A measure of dispersion will have a value of \(0\) if the data points in a data set are the same. However, as the variability of the data increases, so does the value of dispersion measures.
Types of measures of dispersion
The measures of dispersion can be classified into two general categories. These are absolute measures of dispersion and relative measures of dispersion.
Range, variance, standard deviation, and average deviation are included in the category of absolute deviation measures.
These measures have the same unit as the data being examined. Coefficients of dispersion are relative measures of deviation. Such dispersion measures are always dimensionless.
Absolute measures of dispersion
The most common absolute measures of deviation are:
Range: Given a set of data, the range can be defined as the difference between the maximum and the minimum value.
Variance: The average squared deviation from the mean of the given data set is known as a variance. This measure of dispersion examines the spread of the data about the mean. The formula of variance is:
\(\color{blue}{σ^2=\frac{1}{n}\sum _{i=1}^n\:\left(x_i-x\:̅\:\right)^2\:}\)
where \(n\) is the number of observations and \(x¯\) is the mean.
Standard deviation: It shows the square root of the variance of the standard deviation. Therefore, the standard deviation also measures the variation of the data about the mean. The formula of standard deviation is:
\(\color{blue}{σ=\sqrt{σ^2}}\)
Mean Deviation: Mean deviation shows the mean of the data’s absolute deviation about the central points. These center points can be the mean, median, or mode. The formula for mean deviation is:
\(\color{blue}{\frac{1}{n}\:\sum _{i=1}^n|x_i-x\:̅\:|\:}\)
Where \(x¯\) is the central value and denotes the mean, median, or mode.
Measures of Dispersion – Example 1:
Find the population standard deviation of the data set. \({1, 4, 8, 7, 14}\)
Solution: Standard deviation is a measure of dispersion given by the formula \(σ=\sqrt{σ^2}\):
\(x¯=\frac{1+4+8+7+14}{5}=6.8\)
\(σ^2=\frac{\left(1\:-\:6.8\right)^2+\left(4\:-\:6.8\right)^2+\left(8\:-\:6.8\right)^2+\left(7\:-\:6.8\right)^2+\left(14\:-\:6.8\right)^2}{5}=18.96\)
\(σ=\sqrt{18.96}= 4.35\)

Related to This Article
More math articles
- Free Grade 7 English Worksheets for Oregon Students
- The Best Grade 4 Math Book for Rhode Island Students
- How to Find Patterns of Equivalent Fractions?
- Full-Length 6th Grade IAR Math Practice Test-Answers and Explanations
- The Best Grade 4 ELA Practice Tests for Ohio Students
- Top 10 8th Grade STAAR Math Practice Questions
- Factors and Factor Pairs for 4th Grade
- Treasure Hunt in Geometry: How to Navigate Through Polygons’ Scale Drawings
- In-Depth Analysis of Vector Function Derivatives: Theory and Practical Applications
- How to Find Proportional Ratios? (+FREE Worksheet!)


What people say about "How to Measures of Dispersion? - Effortless Math"?
No one replied yet.