How to Graph Absolute Value Function?
The process of charting absolute value equations can be reduced to a few specific steps that help to develop any type of absolute value graph. In this step-by-step guide, you will become more familiar with the steps of graphing an absolute value function.

The absolute value represents the distance of a number on the number line from the origin, better known as zero. The absolute value of a number is never negative. It ignores in which direction from zero the number lies, it only matters how far it is.
Related Topics
A step-by-step guide to graphing absolute value function
Let’s look at the most basic graph of the absolute value function, \(y=|x|\)
Most of the absolute value function graphs will have a somewhat similar shape, a \(V\)-like structure with a vertex.
The following steps will be useful in graphing absolute value functions:
- Step 1: Before plotting any absolute value function, first, we must plot the absolute value parent function:
\(y=|x|\)
Let us take some random values for \(x\).
\(x=−3→y=|−3|=3→(−3,3)\)
\(x=−2→y=|−2|=2→(−2,2)\)
\(x=−1→y=|−1|=1→(−1,1)\)
\(x=0→y=|0|=0→(0,0)\)
\(x=1→y=|1|=1→(1,1)\)
\(x=2→y=|2|=2→(2,2)\)
\(x=3→y=|3|=3→(3,3)\)
If we plot these points on the graph sheet, we will get a graph as given below.
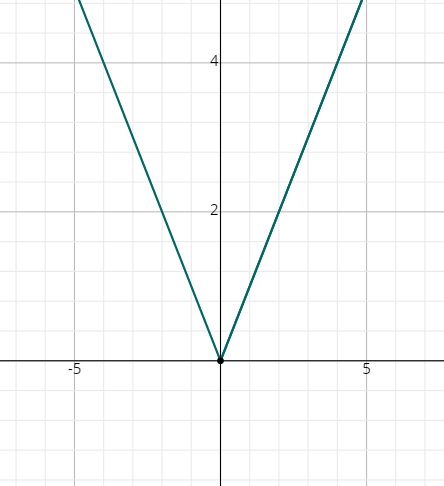
When we look at the above graph, clearly the vertex is \((0, 0)\).
- Step 2: Write the given absolute value function as \(y−k=|x−h|\).
- Step 3: To get the vertex of the absolute value function above, equate \((x – h)\) and \((y – k)\) to zero, that is,
\(x−h=0\) and \(y−k=0\)
\(x=h\) and \(y=k\)
Therefore, the vertex is \((h, k)\).
- Step 4: According to the vertex, we have to shift the above graph.
Note: If we have negative signs in front of absolute signs, we have to flip the curve over.
Graphing Absolute Value Function – Example 1:
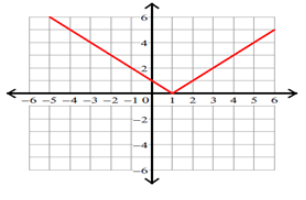
Graphing absolute value function \(y=|x−1|\).
Solution:
The given absolute value function is in the form: \(y−k=|x−h|\)
That is, \(y=|x−1|\)
To get the vertex, equate \((x – 1)\) and \(y\) to zero.
\(x-1=0\) and \(y=0\)
\(x=1\) and \(y=0\)
Therefore, the vertex is \((1,0)\).
So, the absolute value graph of the given function is:
Exercises for Graphing Absolute Value Function
Graph following absolute value function.
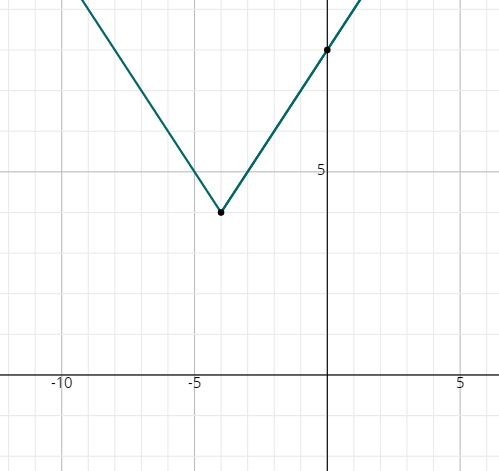
- \(\color{blue}{y=\left|x+4\right|+4}\)
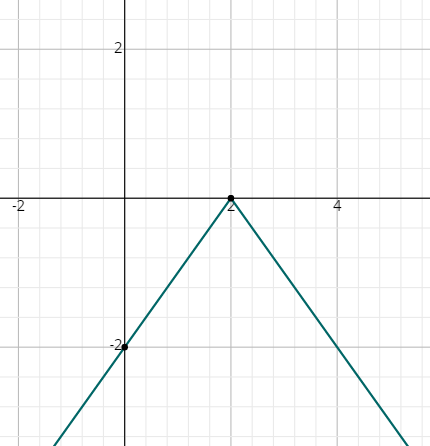
- \(\color{blue}{y=-\left|x-2\right|}\)
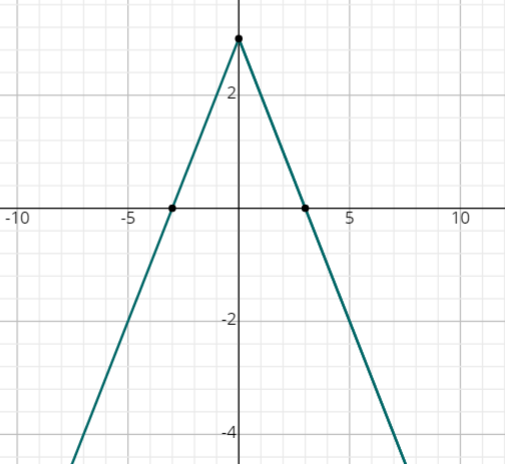
- \(\color{blue}{y=-\left|x\right|+3}\)
- \(\color{blue}{y=\left|x+4\right|+4}\)
- \(\color{blue}{y=-\left|x-2\right|}\)
- \(\color{blue}{y=-\left|x\right|+3}\)

Related to This Article
More math articles
- How to Prepare for the Next-Generation ACCUPLACER Math Test?
- Understanding Betting Odds
- Sandy Savings: A Guide to How to Calculate Sales Tax on Your Beach Vacation
- Exploring Line and Rotational Symmetry
- 5th Grade Common Core Math Worksheets: FREE & Printable
- FREE 3rd Grade FSA Math Practice Test
- FREE 6th Grade PARCC Math Practice Test
- Stand-Up Desks for Teachers and Students
- Case File: How to Solve Multi-step Problems Involving Percent
- How to Master the Pythagorean Theorem and Right Triangles


What people say about "How to Graph Absolute Value Function? - Effortless Math: We Help Students Learn to LOVE Mathematics"?
No one replied yet.