How to Find Independent and Dependent Variables in Tables and Graphs?
In this step-by-step guide, you will learn how to find independent and dependent variables in tables and graphs.

A step-by-step guide to finding independent and dependent variables in tables and graphs
An independent variable is considered as the one being controlled in the equation.
A dependent variable is considered as the one that changes due to that control.
The independent variables typically are in the left-hand column of the data table.
The dependent variables typically are in the right-hand column of the data table.
The “independent” variable is on the \(x\)-axis (horizontal one).
The “dependent” variable is on the \(y\)-axis (vertical one).
Here’s a step-by-step guide to finding independent and dependent variables in tables and graphs:
Step 1: Understand the concept of independent and dependent variables
Before you can identify the independent and dependent variables, you need to understand what these terms mean.
In general, the independent variable is the variable that is being manipulated or changed in an experiment, while the dependent variable is the variable that is being measured or observed in response to the changes made to the independent variable.
Step 2: Look for the relationship between the variables
When looking at a table or graph, you should first try to identify any patterns or relationships between the variables. For example, if you are looking at a graph of distance versus time, you may notice that as time increases, the distance traveled also increases.
Step 3: Identify the axis labels
Next, look at the labels of the axes to determine which variable is being plotted on each axis. The independent variable is typically plotted on the horizontal \((x)\) axis, while the dependent variable is plotted on the vertical \((y)\) axis.
Step 4: Determine which variable is being manipulated
In a table, the independent variable is typically listed in the first column, while the dependent variable is listed in the second column. Look at the values in the independent variable column to determine which variable is being manipulated or changed.
Step 5: Determine which variable is being observed
In a table, the dependent variable is typically listed in the second column, while the independent variable is listed in the first column. Look at the values in the dependent variable column to determine which variable is being observed or measured in response to the changes made to the independent variable.
Step 6: Interpret the results
Once you have identified the independent and dependent variables, you can interpret the results. For example, if you are looking at a graph of distance versus time, the independent variable is time (since time is being manipulated) and the dependent variable is the distance (since the distance is being observed in response to the changes made to time).
Finding Independent and Dependent Variables in Tables and Graphs – Example 1
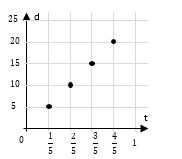
Determine independent and dependent variables according to the graph. Then, write the relationship between the dependent and the independent variable.
Elli rides a bicycle. The graph shows the relationship between the time, \(t\), in hours and distances, \(d\), in kilometers.

Solution:
According to the graph, the distance depends on the number of hours.
So, time is independent and distance is dependent.
If you multiply t by \(25\), you get \(d\).
\(\frac{1}{5}×25=\frac{25}{5}=5, \frac{2}{5}×25=\frac{50}{5}=10, \frac{3}{5}×25=\frac{75}{5}=15, \frac{4}{5}×25=\frac{100}{5}=20, 1×25=25\)
So, \(t\)\(×25=\)\(d, t\)\(=\) independent, \(d\)\(=\)dependent
Finding Independent and Dependent Variables in Tables and Graphs – Example 2
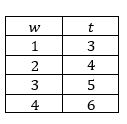
Determine independent and dependent variables according to the table. Then, write the relationship between the dependent and the independent variable.
Luci is packing muffins in a box at the store. The table shows the relationship between the weight of the muffins she packs, \(w\), and the total weight of the packed box, \(t\).

Solution:
According to the table, the total weight of the packs depends on the weight of each muffin she packed.
If you add \(2\) to \(w\), you get \(t\). \(1+2=3, 2+2=4, 3+2=5, 4+2=6\)
So, \(w\)\(+2=\)\(t, w\)\(=\) independent, \(t\)\(=\) dependent
Related to This Article
More math articles
- How to Solve Word Problems of Calculating Profit
- ASVAB Arithmetic and Mathematics Preview
- Unlocking the Power of Visualizations: How to Use Diagrams and Drawings to Master Math Concepts
- Number Properties Puzzle – Challenge 18
- 5th Grade ILEARN Math Worksheets: FREE & Printable
- FREE 8th Grade PSSA Math Practice Test
- Top 10 Free Websites for ACCUPLACER Math Preparation
- The Ultimate PSAT 10 Math Course (+FREE Worksheets & Tests)
- Newton’s Technique to Fish Out the Roots
- What is Rationalizing Trigonometric Functions: Useful Techniques to Simplify Limits


What people say about "How to Find Independent and Dependent Variables in Tables and Graphs? - Effortless Math: We Help Students Learn to LOVE Mathematics"?
No one replied yet.