How to Complete a Table and Graph a Two-Variable Equation?
Welcome to this step-by-step guide on how to complete a table and graph a two-variable equation!
By following this guide, you'll gain a comprehensive understanding of the process and be able to apply it to various mathematical problems.

A step-by-step guide to complete a table and graph a two-variable equation
Here is a step-by-step guide on how to complete a table and graph a two-variable equation:
- Identify the two variables in the equation: The two variables in a two-variable equation are typically represented by \(x\) and \(y\). Identify which variables are involved in your equation.
- Choose values for \(x\): Choose a set of values for x that are meaningful and representative of the problem or situation. It’s often helpful to choose a range of values that span the relevant domain of \(x\).
- Substitute the chosen values of \(x\) into the equation: For each chosen value of \(x\), substitute it into the equation and solve for \(y\). This will give you the corresponding value of y for that particular value of \(x\).
- Record the \(x-y\) pairs in a table: Record each pair of \(x\) and \(y\) values in a table with two columns labeled “\(x\)” and “\(y\)”. Be sure to label each row with the corresponding value of \(x\).
- Plot the points on a graph: Create a coordinate plane by drawing two perpendicular axes labeled “\(x\)” and “\(y\)”. Plot each point from the completed table on the graph by locating its \(x\) and \(y\) values on the axes and marking it with a point.
- Connect the points with a line or curve: After plotting all the points on the graph, connect them with a line or curve that best fits the data. The shape of the line or curve depends on the nature of the equation. For example, a linear equation will have a straight line, while a quadratic equation will have a curve.
- Label the graph: Be sure to label the axes with their corresponding variables (\(x\) and \(y\)) and include a title that describes the equation and what the graph represents.
- Analyze the graph: Once the graph is complete, analyze it to determine any patterns or trends in the data. Look for relationships between \(x\) and \(y\), such as positive or negative correlations. The graph can also be used to make predictions and extrapolations about the data beyond the range of values included in the table.
Complete a Table and Graph a Two-Variable Equation – Example 1
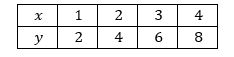
Complete the table. Then graph the equation.
\(y=2x\)
Solution:
Put the value of \(x\) into the equation and calculate \(y\) to find the \(y\)-value.
\(y=2×1=2, y=2×2=4, y=2×3=6 y=2×4=8\)
Write the values in the table as ordered pairs: \((1:2),(2:4),(3:6),(4:8)\)
So,
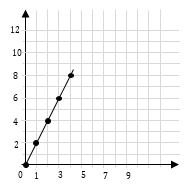
Now, graph \((1:2),(2:4),(3:6),(4:8)\).

Related to This Article
More math articles
- 8th Grade MCA Math Worksheets: FREE & Printable
- How to Write Polynomials in Standard Form? (+FREE Worksheet!)
- Top 10 ParaPro Math Practice Questions
- FREE 5th Grade MEAP Math Practice Test
- How to Use Comparison test for Convergence
- How to Find the Direction of Vectors?
- FREE ISEE Middle Level Math Practice Test
- Online Math Tutoring Tools: The Top 5 tools
- Dual Degree Programs: A Complete Guide
- PSAT 10 Math Worksheets: FREE & Printable


What people say about "How to Complete a Table and Graph a Two-Variable Equation? - Effortless Math: We Help Students Learn to LOVE Mathematics"?
No one replied yet.