How to Graph the Cosine Function?
Cosine is one of the primary mathematical trigonometric ratios. In this guide, you will learn more about the graph of the cosine function.

A step-by-step guide to graphing the cosine function
Cosine is one of the primary mathematical trigonometric ratios. The cosine can be defined as the ratio of the length of the base to the length of the hypotenuse in a right triangle.
\(\color{blue}{cos\:x\:=\frac{Adjacent\:Side}{Hypotenuse}=\frac{Base}{Hypotenuse}\:}\)
where \(x\) is the acute angle between the base and the hypotenuse.
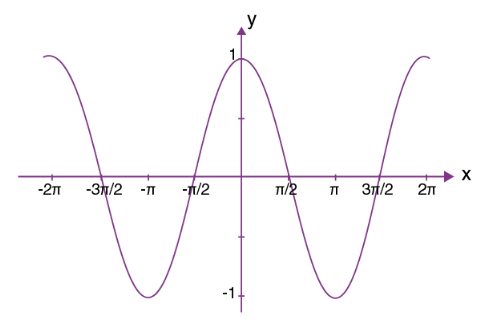
A cosine graph or \(cos\) graph is a top-down graph just like a \(sin\) graph. The only difference between a \(sin\) graph and a \(cos\) graph is that a sine graph starts at \(0\) while a cos graph starts at \(90\) (or \(\frac{\pi }{2})\). The \(cos\) plot given below starts at \(1\) and decreases to \(-1\) and then starts increasing again.

Related to This Article
More math articles
- SSAT Upper-Level Math Worksheets: FREE & Printable
- What Are the Applications of Inverse Trigonometric Functions?
- How to Graph Radical Functions
- Top 10 CLEP College Mathematics Prep Books (Our 2023 Favorite Picks)
- 3rd Grade Georgia Milestones Assessment System Math FREE Sample Practice Questions
- How to Identify the Change, Price, or Amount Paid
- 8th Grade M-STEP Math Worksheets: FREE & Printable
- Which Test Should You Take: GED, TASC, or HiSET?
- Full-Length ISEE Lower Level Math Practice Test-Answers and Explanations
- Top 10 5th Grade Georgia Milestones Assessment System Math Practice Questions


What people say about "How to Graph the Cosine Function? - Effortless Math: We Help Students Learn to LOVE Mathematics"?
No one replied yet.