How to Graph Linear Inequalities? (+FREE Worksheet!)
Learn how to graph linear inequalities using a testing point in a few simple steps.

Related Topics
- How to Find Midpoint
- How to Find Distance of Two Points
- How to Find Slope
- How to Write Linear Equations
- How to Graph Lines by Using Standard Form
Step by step guide to graphing linear inequalities
- First, graph the “equals” line.
- Choose a testing point. (it can be any point on both sides of the line.)
- Put the value of \((x, y)\) of that point in the inequality. If that works, that part of the line is the solution. If the values don’t work, then the other part of the line is the solution.
The Absolute Best Books to Ace Pre-Algebra to Algebra II

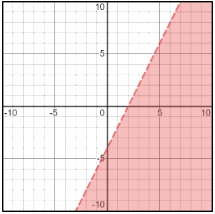
Graphing Linear Inequalities – Example 1:
Sketch the graph of \(y<2x-4\).
Solution:
First, graph the line:
\(y=2x-4\). The slope is \(2\) and \(y\)-intercept is \(-4\).
Then, choose a testing point. The easiest point to test is the origin: \((0,0)\)
\((0,0)→y<2x-4→0<2(0)-4→0<-4\)
\(0\) is not less than \(-4\). So, the other part of the line (on the right side) is the solution.
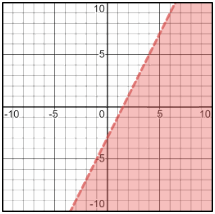
Graphing Linear Inequalities – Example 2:
Sketch the graph of \(y<2x-3\).
Solution:
First, graph the line:
\(y=2x-3\). The slope is \(2\) and \(y\)-intercept is \(-3\).
Then, choose a testing point. The easiest point to test is the origin: \((0,0)\)
\((0,0)→y<2x-3→0<2(0)-3→0<-3\)
\(0\) is not less than \(-3\). So, the other part of the line (on the right side) is the solution.
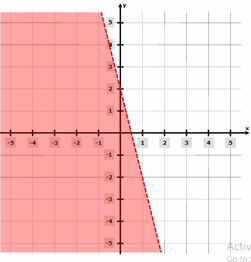
Exercises for Graphing Linear Inequalities
Sketch the graph of each linear inequality.
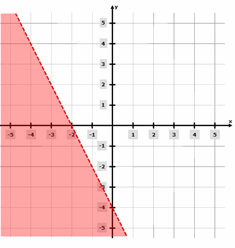
- \(\color{blue}{y < – 4x + 2}\)

- \(\color{blue}{2x + y < – 4}\)
Download Graphing Linear Inequalities Worksheet

- \(\color{blue}{y < – 4x + 2}\)
- \(\color{blue}{2x + y < – 4}\)
The Greatest Books for Students to Ace the Algebra


Related to This Article
More math articles
- 3rd Grade MCAS Math Practice Test Questions
- How Is the ALEKS Test Scored?
- Top 10 3rd Grade STAAR Math Practice Questions
- Detour of Variable Changes: A Complete Exploration of Related Rates
- How to Divide Polynomials Using Long Division?
- The Ultimate 7th Grade DCAS Math Course (+FREE Worksheets)
- Using Models to Represent Decimal Number Place Value
- Top 10 SSAT Lower Level Math Practice Questions
- Division Dynamics: How to Solve Word Problems with Multi-digit Dividends and One-digit Divisors!”
- Using Number Lines to Subtract Integers


What people say about "How to Graph Linear Inequalities? (+FREE Worksheet!) - Effortless Math: We Help Students Learn to LOVE Mathematics"?
No one replied yet.