How to Graph Functions

How to Graph Functions
Graphing a function means turning a rule into a picture: feed in \(x\)-values, get \(y\)-values, plot the points, and connect them. Once you know the shape each family makes — a line, a parabola, a V — you can sketch fast. We’ll build that instinct with verified graphs, a worksheet maker, and flashcards a tap away.

To graph a function, you turn its rule into a picture: choose some \(x\)-values, run them through the function to get \(y\)-values, plot those points, and connect them. The payoff is recognizing that each family of functions makes a predictable shape — a line, a parabola, a V — so before long you’ll sketch them without plotting a single point. Let’s build that eye.
What Is the Graph of a Function?
The graph of a function is the set of all points \((x, y)\) where \(y = f(x)\). In plain terms: every input and its matching output, plotted together. A handy table of inputs and outputs is the bridge from the rule to the picture.
How to graph a function (3 steps):
- Make a table: pick a few \(x\)-values and compute \(y = f(x)\).
- Plot the \((x, y)\) points.
- Connect them with the shape that fits the family.
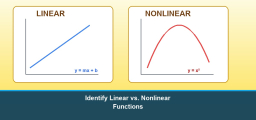
Know the Shape Each Family Makes
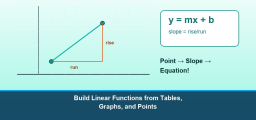
Linear → a line
\(f(x)=mx+b\). Straight, constant slope.
Quadratic → a parabola
\(f(x)=ax^2+\dots\). A U-shaped curve.
\(|x|\) → a V
\(f(x)=|x|+\dots\). Two rays meeting at a point.
Graphing \(f(x) = 2x + 1\)
Build a quick table: \(f(0)=1\), \(f(1)=3\), \(f(2)=5\). Plot \((0,1)\), \((1,3)\), \((2,5)\) and connect — a straight line, because it’s linear. Every input lands exactly on the line.
📄 Get a graphing worksheetGraphing \(f(x) = x^2 – 4\)
Squaring bends the graph into a parabola. The lowest point (vertex) is \((0,-4)\), and it crosses the \(x\)-axis at \(-2\) and \(2\). Tabulating \(x=-2,-1,0,1,2\) gives \(y=0,-3,-4,-3,0\) — notice the mirror symmetry around the vertex, your shortcut for plotting any parabola. (A negative leading coefficient would flip it to open downward.)
📇 Review function formsWorked Examples
Spot the family, then place it — each function’s shape is graphed below.
Example A — Evaluate a linear function
For \(f(x)=2x+1\), find \(f(3)\).
- Substitute: \(f(3) = 2(3) + 1\).
- Simplify: \(7\).
- That’s the point \((3,7)\) on the line.
Answer: \(f(3)=7\) (line)
Example B — Evaluate a quadratic
For \(f(x)=x^2-4\), find \(f(-3)\).
- Substitute in parentheses: \((-3)^2 – 4\).
- Squaring a negative is positive: \(9 – 4\).
- \(5\) — the point \((-3,5)\) on the parabola.
Answer: \(f(-3)=5\) (parabola)
Example C — Absolute value
For \(f(x)=|x|-2\), find \(f(-5)\) and \(f(0)\).
- \(f(-5) = |-5| – 2 = 5 – 2 = 3\).
- \(f(0) = 0 – 2 = -2\) — the corner of the V.
- The graph is a V with vertex \((0,-2)\).
Answer: 3 and −2 (V-shape)
Example D — Read the family
What shape does \(f(x)=x^2+1\) make?
- The highest power is 2.
- Power 2 means a parabola — a U opening up.
- The \(+1\) lifts the vertex to \((0,1)\).
Answer: parabola, vertex \((0,1)\)
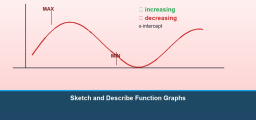
Graphs in the Wild
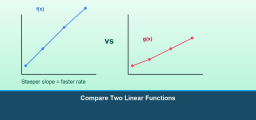
Function graphs are how we see behavior. A linear graph shows steady change, like distance on a steady drive. A parabola shows something that rises then falls, like a ball’s height or a profit that peaks. A V-shaped absolute-value graph shows distance from a target — zero at the target, growing either way. Recognizing the shape tells you the story at a glance, before you compute anything.
Slip-Ups That Cost Easy Points
- Mishandling negatives in \(f(x)\). \((-3)^2 = 9\), not \(-9\). Substitute carefully and use parentheses.
- Connecting a parabola with straight segments. A quadratic curves smoothly — plot enough points near the vertex to show the bend.
- Too few points. Two points define a line, but a parabola or V needs several (including the turning point) to graph honestly.
- Forgetting the family’s shape. Identify the highest power first; it tells you whether to expect a line, a parabola, or something else before you plot.
Your Turn: Evaluate, Then Picture It
Evaluate each function, and name the shape its graph makes. Reveal to check.
- \(f(x)=3x-2\); find \(f(4)\)
- \(f(x)=x^2+1\); find \(f(-2)\)
- \(f(x)=|x+1|\); find \(f(-4)\)
- \(f(x)=-2x+5\); find \(f(3)\)
Show answers
- \(\color{blue}{f(4)=10 \text{ (line)}}\)
- \(\color{blue}{f(-2)=5 \text{ (parabola)}}\)
- \(\color{blue}{f(-4)=3 \text{ (V-shape)}}\)
- \(\color{blue}{f(3)=-1 \text{ (line)}}\)
Make Your Own Function-Graphing Worksheet
Generate fresh functions to evaluate and graph, with a full answer key — print or save as a PDF.
Frequently Asked Questions
How do I graph a function from its equation?
Graph a function in four steps:
- Pick several \(x\)-values.
- Compute \(y=f(x)\) for each.
- Plot the \((x,y)\) points.
- Connect them with the family’s shape — a line for linear, a smooth U for quadratic, a V for absolute value.
How do I know what shape the graph will be?
The highest power of \(x\) decides it: power 1 gives a straight line, power 2 gives a parabola. An absolute value makes a V. Identify the family first, then place it with a few points.
What is \(f(x)\) notation?
\(f(x)\) just names the output of the function for a given input \(x\). \(f(3)=7\) means “when the input is 3, the output is 7,” which is the point \((3,7)\) on the graph.
How many points should I plot?
A line needs only two, but a parabola or V needs several — including the turning point — so the curve’s shape is clear and accurate.
Related Topics
Continue Your Study
Ready for the next step? Pick up right where this lesson leaves off:

Related to This Article
More math articles
- Sweepstakes Casinos Decoded: Gold Coins, Sweeps Coins, and Real Probability
- How to Multiply and Divide Complex Numbers? (+FREE Worksheet!)
- How to Solve Systems of Equations? (+FREE Worksheet!)
- Best Calculators for CA Exams
- 7th Grade ILEARN Math Worksheets: FREE & Printable
- How to Find Real Zeros of Polynomials
- How to Apply Integers Addition and Subtraction Rules?
- Grade 6 Discussion and Research Skills: Stronger Speaking, Listening, Notes, and Sources
- Top 10 Tips You MUST Know to Retake the TSI Math
- Free Grade 8 English Worksheets for Iowa Students


What people say about "How to Graph Functions - Effortless Math: We Help Students Learn to LOVE Mathematics"?
No one replied yet.