How to Graph Trigonometric Functions?
We can plot diagrams of different trigonometric functions with a range of their principal values. Learn how to plot diagrams of trigonometric functions by the following step-by-step guide.
Trigonometric functions are the basic six functions that have a domain input value as an angle of a right triangle, and a numeric answer as the range. The trigonometric function is also called the trig function.
Related Topics
- How to Evaluate Trigonometric Function
- How to Solve Angles and Angle Measure
- How to Graph Inverse Trigonometric Functions
A step-by-step guide to trigonometric functions graph
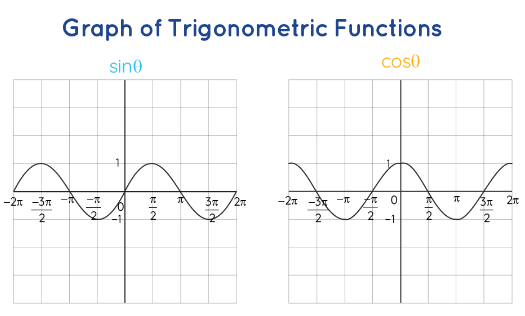
Graphs of trigonometric functions have the domain value of \(θ\) shown on the horizontal \(x\)-axis and the range value along the vertical \(y\)-axis.
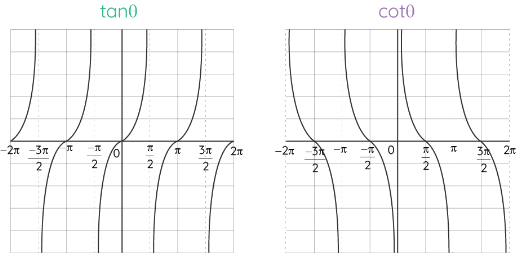
The graphs of \(sin\:\theta\) and \(tan\:\theta\) pass through the origin and the graphs of other trigonometric functions do not pass through the origin.
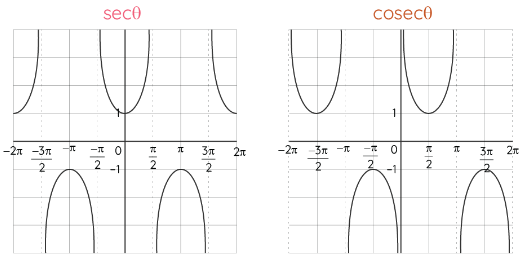
The range of \(sin\:\theta\) and \(cos\:\theta\) is limited to \([-1, 1]\). The range of infinite values is presented as drawn beside the dotted lines.

Related to This Article
More math articles
- 10 Most Common ISEE Upper-Level Math Questions
- 8th Grade IAR Math FREE Sample Practice Questions
- Calculus Simplified: Essential Integral Formulas for Mathematical Success
- How to Find Elapsed Time?
- 8th Grade MAP Math Worksheets: FREE & Printable
- Top 10 OAR Math Practice Questions
- Full-Length DAT Quantitative Reasoning Practice Test-Answers and Explanations
- The Ultimate FTCE General Knowledge Math Course (+FREE Worksheets & Tests)
- Using Number Lines to Subtract Integers
- How to Identify Real Numbers


What people say about "How to Graph Trigonometric Functions? - Effortless Math: We Help Students Learn to LOVE Mathematics"?
No one replied yet.