How to Graph the Cotangent Function?
Cotangent is one of the trigonometric ratios. In this step-by-step guide, you will learn more about the graph of the cotangent function.

Step-by-step guide to graphing the cotangent function
Cotangent is one of the basic trigonometric ratios. It is usually represented as \(cot x\), where \(x\) is the angle between the base and the hypotenuse of a right triangle. Alternative names of cotangent are cotan and cotangent \(x\).
The cotangent formula is:
\(\color{blue}{cot\:θ=\frac{Adjacent\:side}{Opposite\:side}}\)
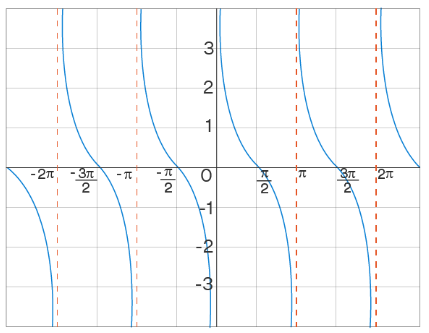
Since the cotangent function is not defined for integer multiples of \(π\), the vertical asymptote exists at all multiples of \(π\) in the cotangent graph. Also, the cotangent is \(0\) at all odd multiples of \(\frac{π}{2}\). Also, in an interval say \((0, π)\), the values of the cot decrease as the angles increase. So \(cot\) is a decreasing function. Then, the graph of the cotangent function looks like this.

Related to This Article
More math articles
- Best Calculators for Linear Algebra and Calculus
- The Ultimate 7th Grade MAAP Math Course (+FREE Worksheets)
- How to Solve Rational Exponents and Radicals?
- How to Accurately Calculate the Area Between Polar Curves Using Integrals
- 4th Grade RICAS Math Worksheets: FREE & Printable
- The Ultimate 7th Grade DCAS Math Course (+FREE Worksheets)
- Top 10 Tips to Overcome PERT Math Anxiety
- How to Identify Expressions and Equations?
- How to Solve Word Problems by Adding Three or More Fractions
- 3rd Grade PARCC Math Worksheets: FREE & Printable


What people say about "How to Graph the Cotangent Function? - Effortless Math: We Help Students Learn to LOVE Mathematics"?
No one replied yet.