Blog

You can find helpful articles about mathematics and test prep in the Effortless Math blog.

Interested in Becoming an Effortless Math Guest Blogger? Click here

Search in Blog articles.

Hand-drawn short run and long run comic contrasting a restaurant working within a fixed kitchen with its owner and architect planning adjustable space and equipment.

Short Run vs. Long Run: Shutdown, Exit and Fixed Costs

Compare short-run shutdown with long-run exit, fixed fees and per-unit costs. Work through examples and three original interactive questions.

Hand-drawn revenue and profit comic showing a furniture sale, costs and remaining profit, a public revenue transfer, and a separate unrealized trade to distinguish transfers from deadweight loss.

Revenue vs. Profit: Transfers, Surplus and Deadweight Loss

Separate revenue from economic profit and transfers from deadweight loss. Build a surplus ledger and try three original interactive questions.


Hand-drawn marginal and average comic using honey production to contrast a total collection, equal per-worker portions, and one highlighted additional jar.

Marginal and Average Values: Product, Cost and Revenue

Hand-drawn movement and shift comic showing students comparing movement between points on one demand curve with a rightward shift of the entire demand relationship.

Demand and Supply Shifts vs. Movements Along Curves

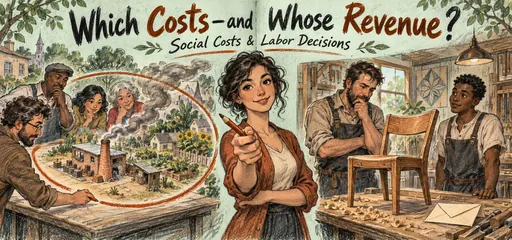
Hand-drawn social and factor market comic contrasting a community accounting for workshop pollution with a carpenter comparing an additional workers output and hiring cost.

Marginal Curves: Social Cost, Labor Demand and Monopsony

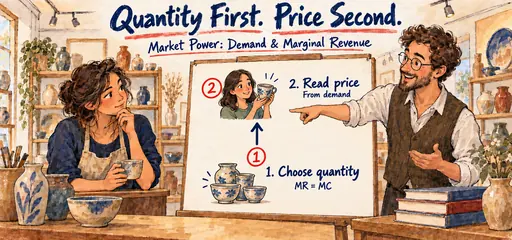
Hand-drawn market power comic showing a pottery seller and tutor finding quantity where marginal revenue meets marginal cost, then moving up to demand to read price.

Monopoly Demand and Marginal Revenue: Price and Profit

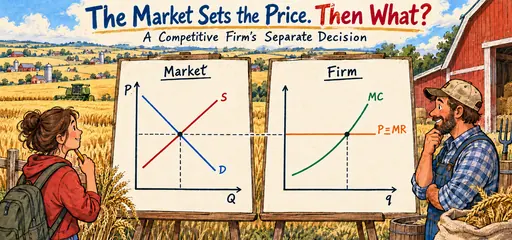
Hand-drawn competitive firm comic showing a wheat farmer and student comparing market supply and demand with a separate firm graph, transferring price to a horizontal marginal revenue line and selecting firm output.

Perfect Competition: Firm and Market Graphs Explained

Hand-drawn supply and demand comic showing a student marking the original intersection and its price and quantity guides before drawing any market change.

Supply and Demand Graphs: Shifts, Equilibrium and Controls

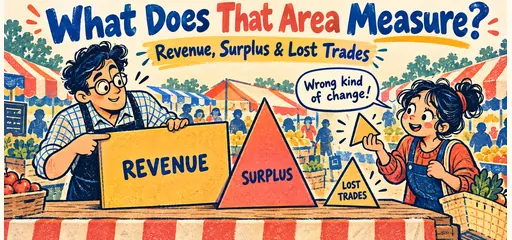
Hand-lettered market-stall comic with a tutor pointing to a revenue rectangle while a student holds a triangle beside shapes labelled surplus and lost trades.

Revenue, Surplus and Deadweight Loss: Graph Areas

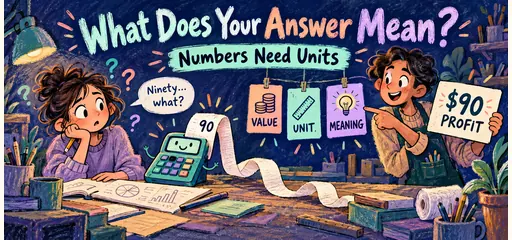
Pastel comic of a puzzled student with a calculator receipt showing 90, while a tutor labels an answer as 90 dollars profit and points to value, unit and meaning cards.

Economic Calculations: Profit, Marginal Values and Units

Cut-paper comic of a student and tutor comparing 10-dollar and 9-dollar price tags with a 10-percent price reduction and 20-percent quantity increase beside a stretching shopping basket.

Price Elasticity: Percentage Changes, Midpoint and Revenue

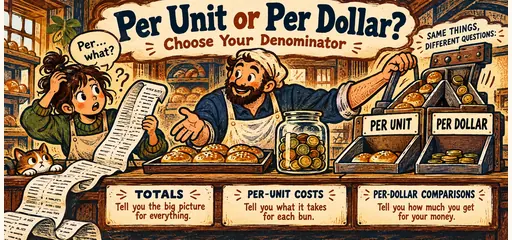
Woodblock bakery comic of a puzzled student with a long receipt and a tutor comparing buns and coins under per-unit and per-dollar labels.

Average Cost and Marginal Utility per Dollar: Ratios